Thursday, June 30, 2011

Max Keiser And Sandeep Jaitly Explain Why Modern Economics Is "Rubbish"

Max Keiser And Sandeep Jaitly Explain Why Modern Economics Is "Rubbish": "

One of Zero Hedge's recurring peeves with modern economics (at its basis, the flawed premise behind modern broken capital markets) is that modern economics, as taught by every Ivy League, and other, institution, and implemented by modern acolytes of Keynes and other spin off theories, is nothing but garbage: a sham voodoo science, which attempts to attribute an empirical basis to something which is inherently irrational. It is this irrationality that alternative, and thus non-mainstream, approaches to popular economics attempt to discredit, so far with zero success, as such a coup d'etat would mean an immediate end of the 'status quo'TM which is for all intents and purposes the only thing that must be maintained in order for the wealthy to retain their wealth, and get far wealthier in the future (Paulson's 3 page blank check proposal to Congress was nothing but a band aid attempt to fix the cumlination of decades of Keynesian failure). The below attached interview between Max Keiser and Sandeep Jaitly provides a 3 minute, must watch glimpse into the basis of Austrian economics, although not through the lense of von Mises, but of Austrian founder Carl Menger, who founded the Austrian school on one axiom only: 'value does not exist outside mankind's consciousness.' As Jaitly goes on to say, 'all other forms of economics, classical, neoclassical economics, ascribe value to something else other than the human mind.' And the punchline, coming from a mathematician: 'all of the equations in neoclassical economics are rubbish. The differential equations describe nothing. Economics is not about mathematics, it is about the human being.'


h/t Mike Krieger

"

Saturday, June 25, 2011

Evaluating Six Investing Mistakes To Avoid

Evaluating Six Investing Mistakes To Avoid: "

I read this article today, and he invited comments. Here are my comments (his words are in italic):


While no investment approach is successful all of the time, here are six common investing mistakes to avoid:


Inability to take a loss and move on.


This is a good point, subject to what I will mention later. If you learn new data about a company, such that you conclude it is worth far less than your original estimates, yes, it is likely you should sell.


But often when investors sell after a disappointment, they sell too cheaply. Bounces often come after disappointments. The key question is to estimate the new value, and calculate a new implied return, and compare that against the implied returns of alternative stocks. Are you holding the stocks with the best set of likely returns?


Not selling winners.


The stock may have been a winner, but that doesn’t mean it can’t win more. Don’t look through the rear-view mirror. Look through the windshield. What is your estimate of value NOW? It may be a lot more valuable than when you first purchased it. If uncertain, sell a little bit of it – it helps psychologically to do that, because taking a gain will make you more comfortable about the remainder of the position.


But if the stock is one of your leading ideas, even after a run-up, why sell any of it? Again, rank the idea against the alternatives that you might reinvest in, and choose the idea that gives you the best likely returns, adjusted for risk.


In my opinion, too many people trim winners that have more to run. Be bloodless, and evaluate the future prospects of the company versus those of alternatives.


Not setting price targets.


Fixed price targets are foolish. Price targets should be dynamic, and shift with the estimated value of the firm. Further, evaluate companies against alternative investments. Only sell the stock of a company when you have a company significantly better in terms of implied returns to replace it with.


Trying to time the market.


I agree that it is difficult to time the market. That doesn’t mean that it is not worth trying to do it on an intermediate-term basis. Follow the credit cycle in the corporate bond market, and you will have a good idea of where stocks are likely to go. When corporate lending falls apart, so do stocks. Also, momentum tends to persist, so be more aggressive when stocks are above their 200-day moving average, and less aggressive when below the average.


Worrying too much about taxes.


In general, I agree. Taxes are a secondary concern, particularly for those who use stocks for charitable giving. Donating appreciated stock is a home-run strategy for those with long-term capital gains.


Not paying attention to your investments.


This is true. If you can’t evaluate you own investments, you should get a professional to do so. By professional, I mean someone trained to understand how investing works, because few truly get how it works. They should at least hold a CFA Charter, and hopefully show some competence beyond that to show that they have transcended the training of one with a CFA Charter.


My main points to you are these:


  1. Don’t look through the rearview mirror. Look through the windshield, and pick the stocks that offer the best returns now.

  2. Only buy a new stock when its implied returns are better than most stocks in your portfolio.

  3. Only sell a stock in order to fund a new stock with better implied returns.

  4. Good investing is a lot of work. If you can’t do it, get a professional to do it for you.

  5. Consider taxes to the degree that it makes sense, and donate appreciated stock when you can.


The author’s six investing errors have a modest amount of merit, but the intelligent investor is dynamic, and adjusts to changing market conditions. Your assets should be managed by those who are similarly dynamic, if you can’t do it yourself.


I read this article today, and he invited comments. Here are my comments (his words are in italic):

While no investment approach is successful all of the time, here are six common investing mistakes to avoid:


Inability to take a loss and move on.


This is a good point, subject to what I will mention later. If you learn new data about a company, such that you conclude it is worth far less than your original estimates, yes, it is likely you should sell.


But often when investors sell after a disappointment, they sell too cheaply. Bounces often come after disappointments. The key question is to estimate the new value, and calculate a new implied return, and compare that against the implied returns of alternative stocks. Are you holding the stocks with the best set of likely returns?


Not selling winners.


The stock may have been a winner, but that doesn’t mean it can’t win more. Don’t look through the rear-view mirror. Look through the windshield. What is your estimate of value NOW? It may be a lot more valuable than when you first purchased it. If uncertain, sell a little bit of it – it helps psychologically to do that, because taking a gain will make you more comfortable about the remainder of the position.


But if the stock is one of your leading ideas, even after a run-up, why sell any of it? Again, rank the idea against the alternatives that you might reinvest in, and choose the idea that gives you the best likely returns, adjusted for risk.


In my opinion, too many people trim winners that have more to run. Be bloodless, and evaluate the future prospects of the company versus those of alternatives.


Not setting price targets.


Fixed price targets are foolish. Price targets should be dynamic, and shift with the estimated value of the firm. Further, evaluate companies against alternative investments. Only sell the stock of a company when you have a company significantly better in terms of implied returns to replace it with.


Trying to time the market.


I agree that it is difficult to time the market. That doesn’t mean that it is not worth trying to do it on an intermediate-term basis. Follow the credit cycle in the corporate bond market, and you will have a good idea of where stocks are likely to go. When corporate lending falls apart, so do stocks. Also, momentum tends to persist, so be more aggressive when stocks are above their 200-day moving average, and less aggressive when below the average.


Worrying too much about taxes.


In general, I agree. Taxes are a secondary concern, particularly for those who use stocks for charitable giving. Donating appreciated stock is a home-run strategy for those with long-term capital gains.


Not paying attention to your investments.


This is true. If you can’t evaluate you own investments, you should get a professional to do so. By professional, I mean someone trained to understand how investing works, because few truly get how it works. They should at least hold a CFA Charter, and hopefully show some competence beyond that to show that they have transcended the training of one with a CFA Charter.


My main points to you are these:


1. Don’t look through the rearview mirror. Look through the windshield, and pick the stocks that offer the best returns now.


2. Only buy a new stock when its implied returns are better than most stocks in your portfolio.


3. Only sell a stock in order to fund a new stock with better implied returns.


4. Good investing is a lot of work. If you can’t do it, get a professional to do it for you.


5. Consider taxes to the degree that it makes sense, and donate appreciated stock when you can.


The author’s six investing errors have a modest amount of merit, but the intelligent investor is dynamic, and adjusts to changing market conditions. Your assets should be managed by those who are similarly dynamic, if you can’t do it yourself.


"

Tuesday, June 21, 2011

Sunk Costs Dilemma: About Those Housing Bears . . .

Sunk Costs Dilemma: About Those Housing Bears . . .: "

From the annals of wrong comes this article, published 6 years ago today (2005): The Housing Bears Are Wrong Again.


Here is a quick excerpt:


“Homebuilders led the stock parade this week with a fantastic 11 percent gain. This is a group that hedge funds and bubbleheads love to hate. All the bond bears have been dead wrong in predicting sky-high mortgage rates. So have all the bubbleheads who expect housing-price crashes in Las Vegas or Naples, Florida, to bring down the consumer, the rest of the economy, and the entire stock market.


None of this has happened. The Federal Reserve has effectively mopped up excess cash and calmed inflation expectations. That’s why bond rates are hovering around 4 percent, with most mortgage rates about a point higher . . .” (emphasis added)


This is a fascinating study of how hard people fight to retain their preconceived belief system, their notions of what they already know – and what challenges that information.


Some of this may be the result of ideological bias, but I suspect most of this is a case of the Sunk Cost dilemma. When you have spent so much time and energy and money –indeed, your entire professional career — acquiring information and a supporting belief system, it is rather challenging to reverse course from that.


Hence, the difficulty in getting someone to recognize events that are outside oft heir experience. Consider this paragraph:


Meanwhile, the homebuilders index has increased 76 percent over the past year, with particularly well-run companies like Toll Brothers up about twice as much. The bubbleheads missed all this because they haven’t done their homework. If they had put a little elbow grease into their analysis, they would have learned that new-housing starts for private homes and apartments haven’t changed much during the past three and a half decades.


If you looked at home-building relative to Income, or to Household Formations, or to GDP, by 2005 it had was already 2 standard deviations away from the historical mean. It is very challenging to convince people what the norm is int he midst of bubble. And in 2005, we were in the middle of the world’s biggest credit bubble.


What fascinates me is how reasonable the arguments against the bubble sound. Read the whole article without the benefit of knowing how it all crumbled, and you will find it is surprisingly persuasive — just as the housing boom reached its peak.


>


Source:

The Housing Bears Are Wrong Again

This tax-advantaged sector is writing how-to guide on wealth creation.

Larry Kudlow

National Review, June 20, 2005
http://article.nationalreview.com/276028/the-housing-bears-are-wrong-again/larry-kudlow


"

Thursday, June 16, 2011

THE TRUTH ABOUT THE ECONOMY IN 2 MINUTES

THE TRUTH ABOUT THE ECONOMY IN 2 MINUTES: "

Robert Reich describes what’s wrong with the economy in 2 minutes. His bullet points (thanks to Stephanie Kelton):


  • The economy doubles since 1980, but wages flat. Where did the money go…

  • All (or most) of the gains went to the super rich. And…

  • With money comes political power. Taxes on super rich slashed, revenues evaporate. This leads to…

  • Huge budget deficits. Middle class agitated, fights for scraps…

  • Middle class divided. Buying and borrowing slow. Resulting in:

  • Anemic recovery/economy.


I would add one very important point that Mr. Reich misses here. The real destruction has come in the growth of the financialization of the US economy. Since the 1970′s when the financialization of the USA began we have seen an increasing number of would-be entrepreneurs leave productive positions for Wall Street jobs where they largely help devise ways to help separate the middle class from their savings. As the country grew more and more wealthy in the 1980′s and 1990′s (thanks to entrepreneurs like Bill Gates) the problem compounded because the demand for Wall Street’s services expanded (higher wealth meant higher demand for protecting that wealth). Wall Street convinces Main Street that the best way to protect their wealth is by giving it to them (2% at a time) and Main Street doesn’t know any better because they don’t (and still don’t) understand how the monetary system or the economic system in the USA actually works so they give their money to a trusted “expert”.


The result is fewer Bill Gates’s (real job producers) and more Gordon Gekkos (company destroyers). The wealth gap grows as Wall Street’s incomes explode, Wall Street deregulates and the result is a weak middle class, rising inflation (largely thanks to the wealth disparity), a debt bubble that results from the middle class trying to sustain their standard of living (“keeping up with the Jones’s!), and ultimately a crash that turns what should have been a garden style recession into a near depression as Wall Street takes advantage of the zero collateral laws to leverage themselves up to the hilt in their never ending search for profit maximization and ultimately even greater pay.


Now we all suffer because of this cannibalization of capitalism.


"

Sunday, June 12, 2011

Sean Corrigan Explains Why "This Cannot End Well"

Sean Corrigan Explains Why "This Cannot End Well": "


From Sean Corrigan Of Diapason Securities

This Cannot End Well

Markets were briefly cheered earlier in the week by news that the Chinese government was planning to relieve its banks of up to $450 bln in poorer quality local authority loans, hence removing a looming threat to the nation's credit-fuelled expansion.

As is usual with China, though, this was both something and nothing. Nothing because the announcement was only one of vague intent rather than a concrete proposal, much less one with a verifiable timetable. As is so often the case, the authorities may well be employing the typical ruse of benefiting from an initial headline effect and the subsequent goldfish memory capability of the vast majority of investors who only want to believe the best about the place, in any case.

Nothing, too, because the 'bail-out' will probably take the time-honoured form of simply re-labelling one form of irredeemable debt as a more prestigious marque—this time, perhaps, one with an MOF imprimatur on it—without altering the fact that it will remain as a low-interest drag on bank balance sheets in perpetuity.

Never mind, the banks can always shore up their balance sheets by selling another slice of overpriced equity to the biddable gweilo suckers who are so anxious to get a piece of the China-to-the-Moon action, even if they then cough up most of the proceeds by making over a series of dividends to their governmental majority shareholders with which these latter will meet the re-packaged junk interest payments.

If this seems a classic shell game of the kind so well described in Walter & Howie's 'Red Capitalism', there were also rather more disconcerting echoes of Frank Dikotter's 'Mao's Great Famine' in an official news story which attributed the calamity, that the recent drought in China has given way to a series of deadly floods, to the failure of the local cadres to arrange for the peasants to 'volunteer' to complete water management projects in the agricultural low season as they used to do in the 60s and 70s.

Given that the during the first of these alone— the risibly named Great Leap Forward— a near-unimaginable 45 million of those same peasants are reckoned to have been starved or beaten to death, the wistfulness with which this was recalled sheds a worrying light on the unsoftened callous which still passes for the heart of the central planner.

At root, of course, the bank lending splurge was a fiscal programme, not a commercial one: one which was inherently monetized and hence one which has lead straight to the inflationary problems of today.

Worse even than that, this New Deal was just as morally corrupting and societally enervating as have been all its less-than illustrious predecessors. In a one-party state, there may have been no need to 'Tax, tax, tax. Spend, spend, spend. Elect, elect, elect,' as Harry Hopkins categorized FDR's cynical exploitation of executive patronage in 1930s America, but the money will nonetheless have gone preferentially to the well-connected - the party loyalists, the SOE apparatchiks, and the princeling- run oligopolies—each eager to extend their fiefdoms as much as possible along the way.

Now that credit is being partly rationed, these, too, are the ones who will suffer last and least, meaning that genuine entrepreneurs are the ones who will have to bear the brunt of an adjustment process which has not only tightened funding and raised interest rates—especially the usurious curb rates which are often their only source of working capital and which some sources say are running at 5% a month—but which has crushed their export margins under the weight of the Yuan's ascent and the sharply raised the cost of both the labour and material inputs they require to stay in business.

Even the state mouthpiece, the Shanghai Times, admitted as much in running the results of a survey conducted by the All-China Federation of Industry and Commerce which said that SMEs across the 16 provinces canvassed were suffering a 'cash crunch' as tight as that experienced at the height of the LEH-AIG Crisis in 2008.

With the Western press full of stories of Chinese 'fraud caps' and with the signal, first ever failure of a domestic IPO this week to top a run of disappointing after-markets for a whole host of flotations, undeniable evidence of the deterioration in the economic environment may coincide with widespread investor distrust to provide a rather salutary end to this latest stage of the Sinomania.

Certainly, equities are beginning to look vulnerable, while the latest trade data shows that exports have been essentially static in Yuan terms for the past six months, with the YOY rate trending down even more sharply than in the run-up to the bust.

Apart from another round of anaemic import-export numbers (e.g., for copper, where we are already back to the stationary, 2001-08 mean), one portentous indicator is the volume of coal exports from Australia — and the corresponding length of the queue off the principal port of Newcastle— given that almost four-fifths of these are bound for either India or the China-Taiwan-Japan-Korea global production hub.

Another country getting little bang for its monetized buck is dear old Blighty— the UK— where well over 90% of gilt issuance has been taken up by the banks, stepping in for the rather more embarrassing direct money printing of the Old Lady herself conducted in 2009.

The author is old enough to remember how controversial was the proposal, mooted and then adopted during the previous housing crash, to insist no longer that, as an act of anti-inflationary prophylaxis, only government debt sold to non-monetary institutions and individuals would count as being 'funded' (admittedly, this was fast becoming a dead-letter with the rapid development of repo markets). We are along way from such days of virtue.

Here, again, we have a direct impediment to the necessary cleansing and re-ordering of society in that the feckless and unfortunate are preferentially receiving finance at the expense of the would-be phoenixes.


Is it any wonder that the country still runs a trade deficit of roughly £100 billion a year (a per capita equivalent of over $800 bln were the US to be as badly placed), despite the 20% decline in its currency (a real effective exchange rate decline which was the biggest undergone of the 57 nations the BIS tracks with the sole exception of benighted Iceland!)?

Is it any wonder that prices are rising so fast (despite the supposedly prohibitive Keynesian presence of an 'output gap') when so much of the money being created is not giving rise to goods and services, but is being used to furnish the means for the unproductive to maintain their soft budget lifestyle in all its £650 billion total, £120 billion deficit majesty?

But if Britain looks no further forward in clearing up the toxic legacy of RobespiBlaire and Culpability Brown (or Crash Gordon, if you prefer), who else will take up the challenge? The Europeans? What, with whatever political will which remains after failing to break the Greek impasse being squandered on the mindless rush to 'decarbonise' and to denuclearise the most successful economies on the Continent simultaneously?

It's not even that there is much of a Plan B, other than that of despoiling the environment, ruining the vistas, decimating the wildlife, and crippling both industrial and household budgets with vast, rent- sucking arrays of unwieldy, uneconomical and largely impractical windmills and solar panels.

As the Swiss environment minister, Doris Leuthard, so marvellously put it, when hailing the Bundesrat's decision to abandon the clean, quiet, low 'footprint' source of 38% of the country's electricity without having any obvious replacement to hand in a small, land-locked country where even shale gas exploration has met with overwhelming regulatory difficulties: 'I believe in a Switzerland of innovation.' Talk about the politics of the Tooth Fairy!

Even as it stands, there are just a few hints that some of the shine may be coming off the Mittelstand's gold stars. Export revenues— while still running at double digit rates— are seeing a progressively faster deceleration, with domestic sales picking up smartly in what may be a sign of the inflationary pressures bubbling up in this notoriously lacklustre sector.

Be aware, too, of the greatly elevated German business reliance on north Asia, whence it sends twice as many exports as in 2005, with their relative scale increasing by half from 22% of EZ exports then, to 35% today. If China sneezes... Gesundheit!


A glance at the chart of Dutch industrial production on the previous page may be telling us that this faltering of pace is proceeding there in a similar fashion and so presumably for similar reasons.

Looking further afield, Japan is not yet in any position to help and—besides—it, too, is now too intimately tied up with what happens on the Asian mainland to provide a separate driver, its tragedy being that it has replaced a dependence on one intemperate giant with a fate closely intertwined with the caprices of two.

As for the US, there is not too much new to say on the monthly data flow, with what there is of note being more long-term in nature, as the quarterly financial numbers show the maintenance of the split between the vitality of Corporate America and that of the rest of the private sector, as well as the contrast between the unretarded profligacy of the state and the ongoing resizing of the 'shadow' banking sector.

What we can also see is the scale of the distortions being introduced into the market where, despite the superficial health of both profits and cash flow (these a touch less impressive if we adjust for either of the US dollar's internal or external loss of value, one should constantly remind oneself), it is apparent that the balance sheet is still being strip-mined to salt the income statement and, more particularly, the per share ratios via debt-financed equity buybacks.


Even as this increases the overall fragility of the corporate structure, however, the Fed's egregious obliteration of capital market pricing signals has kept equities looking 'cheap' - with dividend yields anomalously above an artificially-depressed LIBOR and equity earnings yields at par with QE-shrunken corporate bond yields for the first time in almost three decades.

This cannot end well.

"

Guest Post: It's The Debt, Dummy

Guest Post: It's The Debt, Dummy: "

Submitted by Jim Quinn of The Burning Platform

It's The Debt, Dummy

I think charts tell a story that allows you to disregard the lies
being spewed by those in power. Below are four charts that tell the
truth about our current predicament. The first is from http://www.mybudget360.com/.
The austerity and debt reduction storyline being sold by the MSM is a
crock. The total amount of mortgage debt outstanding peaked at $14.6
trillion in 2008. The total amount of consumer debt (credit cards, auto
loans, student, boats) outstanding peaked at $2.6 trillion in 2008.
Today, mortgage debt outstanding stands at $13.8 trillion, while
consumer debt stands at $2.4 trillion. Therefore, total consumer debt
has declined by $1 trillion in the last three years. The MSM and talking
heads use this data to declare that consumers have been paying down
debt. This is a complete and utter falsehood. The banks have written off
more than $1 trillion, which the American taxpayer has unwittingly
reimbursed them for. Consumers have not deleveraged. They have taken on
more debt since 2008. GMAC (Ally Bank) is handing out 0% down 0%
interest loans like candy again.


Never has a chart shown why the country is such a mess, with no easy
way out. It was the early 1980′s and the Boomers were between 23 years
old and 40 years old. Seventy six million Boomers were in the work
force. Was it the chicken or the egg? The financial industry peddled
debt as the solution to all problems. But, it was up to the Boomers to
take on the debt or live within their means. Boomers chose to live for
today and worry about tomorrow at some later date. There is no doubt
what they did. The chart tells the story. Boomers can moan and blame and
point the finger at others, but they took on the debt in order to live
at a higher standard than their income would allow. This is why 60% of
retirees have less than $50,000 in savings today. This is why 67% of all
workers in the US have less than $50,000 in savings. A full 46% of all
workers have less than $10,000 in savings.


In order for this economy to become balanced again would require
consumer debt to be reduced by $3 to $4 trillion and the savings rate to
double from 5% to 10%. This will never happen voluntarily. Americans
are still delusional. They are actually increasing their debt as credit
card debt sits at $790 billion, student loan debt at $1 trillion, auto
loans at $600 billion, and mortgage debt at $13.8 trillion. The debt
will not decline until an economic Depression wipes out banks and
consumers alike. America will go down with a bang, not a whimper.


Household net worth peaked at $65.8 trillion in Q2 2007. Net worth
fell to $49.4 trillion in Q1 2009 (a loss of over $16 trillion), and net
worth was at $58.1 trillion in Q1 2011 (up $8.7 trillion from the
trough). So, household net worth is still down by $7.7 trillion from its
2007 peak. The really bad news is that the real estate portion of
household net worth dropped from $22.7 trillion in 2007 to $16.1
trillion today, a $6.6 trillion loss. Real estate continues to fall.


You can clearly see who benefitted from the monetary and fiscal
stimulus implemented by Bernanke, Geithner, and Obama. If household net
worth is up $8.7 trillion from the trough in early 2009, but real estate
has continued to fall. This means that the entire increase in net worth
came from stock market gains. As you may or may not know, the top 10%
wealthiest people in the US own 81% of all the stocks in the country.
The other 90% own virtually no stocks, so they have been left
with depreciating houses and inflating bills for energy and food. The
top 10% are about to take another multi-trillion dollar hit in the next
six months as QE2 ends and the stock market implodes. This will knock
the country back into deep recession.


The most amazing chart of all time is the one below showing home
equity since 1952. In a normal non-delusional world, people pay down the
principal on their mortgage month after month, resulting in their
equity in the house methodically rising. National home prices doubled
between 2000 and 2005. One might ask, how in the hell could home equity
drop from 60% to 58% between 2000 and 2005 when home prices went up
100%? Equity should have risen to 75%. Well the delusional Boomers
struck again. The banks made it as easy as hitting the ATM to get equity
out of your house and the Boomers jumped in with both feet, as usual.
Americans withdrew $2.8 trillion of fake equity from their homes between
2003 and 2007. They lived the lifestyles of the rich and famous. BMWs,
Mercedes, cement ponds (pools), new kitchens, Jacuzzis, home theaters,
exotic vacations, hookers, facelifts, size DDs, and putting a little
more in the church basket abounded.


This astounding level of stupidity and hubris left millions of
Americans vulnerable when the bubble popped all over their faces.
Millions have lost their homes. Almost 11 million more are underwater on
their mortgage. There is years of pain to go. Household equity is now
at an all-time low of 38.1%. What makes this number even more amazing is
that 33% of all homes are owned outright with no mortgage. This means
that the 50 million houses with a mortgage have far less than 38.1%
equity. The people who sucked hundreds of thousands out of their houses
to live the good life deserve to get it good and hard.


The last and most humorous graph shows how home price gains are
fleeting, while the debt stays wrapped like an anchor around your neck.
The greatest bubble in history was clear to Robert Shiller, John Mauldin
and many other people with their eyes open. Ben Bernanke was not one of
those people. He thought we had a solid housing market in 2005. Real
estate values fell from 170% of GDP to 110% of GDP today, headed down to
90% or lower by 2015. The mortgage debt behind this real estate has
declined by $634 billion, from 75% of GDP to 65% of GDP. Most of this
was due to default, not payment.


It should be clear to anyone that we have a bit of a debt problem.
The government solutions jammed down our throats since 2008 have added
$7 trillion of debt to the national balance sheet. The only thing
keeping this house of cards from collapsing immediately has been the
extremely low interest rates put in place by the Federal Reserve. The
end of QE2 potentially could result in interest rates rising. If
interest rates were to rise 2%, this country’s economic system would
implode. Time is not on our side. The debt cannot be repaid. The debt
cannot be serviced. The debt has destroyed this country. Years from now
when historians ponder what caused the great American Empire to
collapse, the answer on the exam will be:


IT WAS THE DEBT, DUMMY.

"

Friday, June 10, 2011

Dude! Where’s My Recovery?

Dude! Where’s My Recovery?: "

I initially planned to call this post “Economic Growth, Asset Markets and the Credit Accelerator”, but recent negative data out of America makes me think that this title is more in line with conversations currently taking place in the White House.


(Click here for this post in PDF)


According to the NBER, the “Great Recession” is now two years behind us, but the recovery that normally follows a recession has not occurred. While growth did rise for a while, it has been anaemic compared to the norm after a recession, and it is already trending down. Growth needs to exceed 3 per cent per annum to reduce unemployment—the rule of thumb known as Okun’s Law—and it needs to be substantially higher than this to make serious inroads into it. Instead, growth barely peeped its head above Okun’s level. It is now below it again, and trending down.


Figure 1


Unemployment is therefore rising once more, and with it, Obama’s chances of re-election are rapidly fading.


Figure 2


Obama was assured by his advisors that this wouldn’t happen. Right from the first Economic Report of the President that he received from Bush’s outgoing Chairman of the Council of Economic Advisers Ed Lazear in January 2009, he was assured that “the deeper the downturn, the stronger the recovery”. On the basis of the regression shown in Chart 1-9 of that report (on page 54), I am sure that Obama was told that real growth would probably exceed 5 per cent per annum—because this is what Ed Lazear told me after my session at the Australian Conference of Economists in September 2009.


Figure 3


I disputed this analysis then (see “In the Dark on Cause and Effect, Debtwatch October 2009“), and events have certainly borne out my analysis rather than the conventional wisdom. To give an idea of how wrong this guidance was, the peak to trough decline in the Great Recession—the x-axis in Lazear’s Chart—was over 6 percent. His regression equation therefore predicted that GDP growth in the 2 years after the recession ended would have been over 12 percent. If this equation had born fruit, US Real GDP would be $14.37 trillion in June 2011, versus the recorded $13.44 trillion in March 2011.


Figure 4


So why has the conventional wisdom been so wrong? Largely because it has ignored the role of private debt—which brings me back to my original title.


Economic Growth, Asset Markets and the Credit Accelerator


Neoclassical economists ignore the level of private debt, on the basis of the a priori argument that “one man’s liability is another man’s asset”, so that the aggregate level of debt has no macroeconomic impact. They reason that the increase in the debtor’s spending power is offset by the fall in the lender’s spending power, and there is therefore no change to aggregate demand.


Lest it be said that I’m parodying neoclassical economics, or relying on what lesser lights believe when the leaders of the profession know better, here are two apposite quotes from Ben Bernanke and Paul Krugman.


Bernanke in his Essays on the Great Depression, explaining why neoclassical economists didn’t take Fisher’s Debt Deflation Theory of Great Depressions (Irving Fisher, 1933) seriously:


Fisher’s idea was less influential in academic circles, though, because of the counterargument that debt-deflation represented no more than a redistribution from one group (debtors) to another (creditors). Absent implausibly large differences in marginal spending propensities among the groups, it was suggested, pure redistributions should have no significant macro-economic effects… (Ben S. Bernanke, 2000, p. 24)


Krugman in his most recent draft academic paper on the crisis:


Given both the prominence of debt in popular discussion of our current economic difficulties and the long tradition of invoking debt as a key factor in major economic contractions, one might have expected debt to be at the heart of most mainstream macroeconomic models—especially the analysis of monetary and fiscal policy. Perhaps somewhat surprisingly, however, it is quite common to abstract altogether from this feature of the economy. Even economists trying to analyze the problems of monetary and fiscal policy at the zero lower bound—and yes, that includes the authors—have often adopted representative-agent models in which everyone is alike, and in which the shock that pushes the economy into a situation in which even a zero interest rate isn’t low enough takes the form of a shift in everyone’s preferences…


Ignoring the foreign component, or looking at the world as a whole, the overall level of debt makes no difference to aggregate net worth — one person’s liability is another person’s asset. (Paul Krugman and Gauti B. Eggertsson, 2010, pp. 2-3; emphasis added)


They are profoundly wrong on this point because neoclassical economists do not understand how money is created by the private banking system—despite decades of empirical research to the contrary, they continue to cling to the textbook vision of banks as mere intermediaries between savers and borrowers.


This is bizarre, since as long as 4 decades ago, the actual situation was put very simply by the then Senior Vice President, Federal Reserve Bank of New York, Alan Holmes. Holmes explained why the then faddish Monetarist policy of controlling inflation by controlling the growth of Base Money had failed, saying that it suffered from “a naive assumption” that:


the banking system only expands loans after the [Federal Reserve] System (or market factors) have put reserves in the banking system. In the real world, banks extend credit, creating deposits in the process, and look for the reserves later. The question then becomes one of whether and how the Federal Reserve will accommodate the demand for reserves. In the very short run, the Federal Reserve has little or no choice about accommodating that demand; over time, its influence can obviously be felt. (Alan R. Holmes, 1969, p. 73; emphasis added)


The empirical fact that “loans create deposits” means that the change in the level of private debt is matched by a change in the level of money, which boosts aggregate demand. The level of private debt therefore cannot be ignored—and the fact that neoclassical economists did ignore it (and, with the likes of Greenspan running the Fed, actively promoted its growth) is why this is no “garden variety” downturn.


In all the post-WWII recessions on which Lazear’s regression was based, the downturn ended when the growth of private debt turned positive again and boosted aggregate demand. This of itself is not a bad thing: as Schumpeter argued decades ago, in a well-functioning capitalist system, the main recipients of credit are entrepreneurs who have an idea, but not the money needed to put it into action:


“[I]n so far as credit cannot be given out of the results of past enterprise … it can only consist of credit means of payment created ad hoc, which can be backed neither by money in the strict sense nor by products already in existence…


It provides us with the connection between lending and credit means of payment, and leads us to what I regard as the nature of the credit phenomenon… credit is essentially the creation of purchasing power for the purpose of transferring it to the entrepreneur, but not simply the transfer of existing purchasing power.” (Joseph Alois Schumpeter, 1934, pp. 106-107)


It becomes a bad thing when this additional credit goes, not to entrepreneurs, but to Ponzi merchants in the finance sector, who use it not to innovate or add to productive capacity, but to gamble on asset prices. This adds to debt levels without adding to the economy’s capacity to service them, leading to a blowout in the ratio of private debt to GDP. Ultimately, this process leads to a crisis like the one we are now in, where so much debt has been taken on that the growth of debt comes to an end. The economy then enters not a recession, but a Depression.


For a while though, it looked like a recovery was afoot: growth did rebound from the depths of the Great Recession, and very quickly compared to the Great Depression (though slowly when compared to Post-WWII recessions).


Clearly the scale of government spending, and the enormous increase in Base Money by Bernanke, had some impact—but nowhere near as much as they were hoping for. However the main factor that caused the brief recovery—and will also cause the dreaded “double dip”—is the Credit Accelerator.


I’ve previously called this the “Credit Impulse” (using the name bestowed by Michael Biggs et al., 2010), but I think “Credit Accelerator” is both move evocative and more accurate. The Credit Accelerator at any point in time is the change in the change in debt over previous year, divided by the GDP figure for that point in time. From first principles, here is why it matters.


Firstly, and contrary to the neoclassical model, a capitalist economy is characterized by excess supply at virtually all times: there is normally excess labor and excess productive capacity, even during booms. This is not per se a bad thing but merely an inherent characteristic of capitalism—and it is one of the reasons that capitalist economies generate a much higher rate of innovation than did socialist economies (Janos Kornai, 1980). The main constraint facing capitalist economies is therefore not supply, but demand.


Secondly, all demand is monetary, and there are two sources of money: incomes, and the change in debt. The second factor is ignored by neoclassical economics, but is vital to understanding a capitalist economy. Aggregate demand is therefore equal to Aggregate Supply plus the change in debt.


Thirdly, this Aggregate Demand is expended not merely on new goods and services, but also on net sales of existing assets. Walras’ Law, that mainstay of neoclassical economics, is thus false in a credit-based economy—which happens to be the type of economy in which we live. Its replacement is the following expression, where the left hand is monetary demand and the right hand is the monetary value of production and asset sales:


Income + Change in Debt = Output + Net Asset Sales;


In symbols (where I’m using an arrow to indicate the direction of causation rather than an equals sign), this is:


This means that it is impossible to separate the study of “Finance”—largely, the behaviour of asset markets—from the study of macroeconomics. Income and new credit are expended on both newly produced goods and services, and the two are as entwined as a scrambled egg.


Net Asset Sales can be broken down into three components:


  • The asset price Level; times

  • The fraction of assets sold; times

  • The quantity of assets


Putting this in symbols:


That covers the levels of aggregate demand, aggregate supply and net asset sales. To consider economic growth—and asset price change—we have to look at the rate of change. That leads to the expression:


Therefore the rate of change of asset prices is related to the acceleration of debt. It’s not the only factor obviously—change in incomes is also a factor, and as Schumpeter argued, there will be a link between accelerating debt and rising income if that debt is used to finance entrepreneurial activity. Our great misfortune is that accelerating debt hasn’t been primarily used for that purpose, but has instead financed asset price bubbles.


There isn’t a one-to-one link between accelerating debt and asset price rises: some of the borrowed money drives up production (think SUVs during the boom), consumer prices, the fraction of existing assets sold, and the production of new assets (think McMansions during the boom). But the more the economy becomes a disguised Ponzi Scheme, the more the acceleration of debt turns up in rising asset prices.


As Schumpeter’s analysis shows, accelerating debt should lead change in output in a well-functioning economy; we unfortunately live in a Ponzi economy where accelerating debt leads to asset price bubbles.


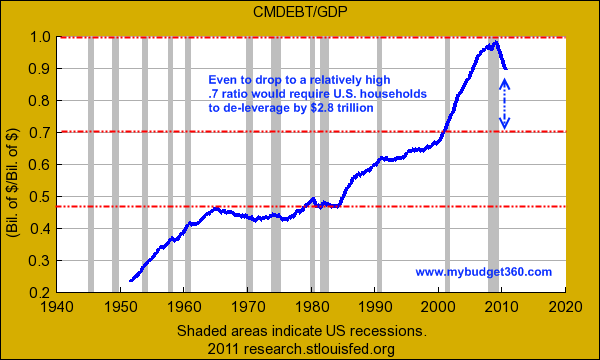
In a well-functioning economy, periods of acceleration of debt would be followed by periods of deceleration, so that the ratio of debt to GDP cycled but did not rise over time. In a Ponzi economy, the acceleration of debt remains positive most of the time, leading not merely to cycles in the debt to GDP ratio, but a secular trend towards rising debt. When that trend exhausts itself, a Depression ensues—which is where we are now. Deleveraging replaces rising debt, the debt to GDP ratio falls, and debt starts to reduce aggregate demand rather than increase it as happens during a boom.


Even in that situation, however, the acceleration of debt can still give the economy a temporary boost—as Biggs, Meyer and Pick pointed out. A slowdown in the rate of decline of debt means that debt is accelerating: therefore even when aggregate private debt is falling—as it has since 2009—a slowdown in that rate of decline can give the economy a boost.


That’s the major factor that generated the apparent recovery from the Great Recession: a slowdown in the rate of decline of private debt gave the economy a temporary boost. The same force caused the apparent boom of the Great Moderation: it wasn’t “improved monetary policy” that caused the Great Moderation, as Bernanke once argued (Ben S. Bernanke, 2004), but bad monetary policy that wrongly ignored the impact of rising private debt upon the economy.


Figure 5


The factor that makes the recent recovery phase different to all previous ones—save the Great Depression itself—is that this strong boost from the Credit Accelerator has occurred while the change in private debt is still massively negative. I return to this point later when considering why the recovery is now petering out.


The last 20 years of economic data shows the impact that the Credit Accelerator has on the economy. The recent recovery in unemployment was largely caused by the dramatic reversal of the Credit Accelerator—from strongly negative to strongly positive—since late 2009:


Figure 6


The Credit Accelerator also caused the temporary recovery in house prices:


Figure 7


And it was the primary factor driving the Bear Market rally in the stock market:


Figure 8


Leads and Lags


I use the change in the change in debt over a year because the monthly and quarterly data is simply too volatile; the annual change data smooths out much of the noise. Consequently the data shown for change in unemployment, house prices and the stock market are also for the change the previous year.


However the change in the change in debt operates can impact rapidly on some markets—notably the Stock Market. So though the correlations in the above graphs are already high, they are higher still when we consider the causal role of the debt accelerator in changing the level of aggregate demand by lagging the data.


This shows that the annual Credit Accelerator leads annual changes in unemployment by roughly 5 months, and its maximum correlation is a staggering -0.85 (negative because an acceleration in debt causes a fall in unemployment by boosting aggregate demand, while a deceleration in debt causes a rise in unemployment by reducing aggregate demand).


Figure 9


The correlation between the annual Credit Accelerator and annual change in real house prices peaks at about 0.7 roughly 9 months ahead:


Figure 10


And the Stock Market is also a creature of the Credit Impulse, where the lead is about 10 months and the correlation peaks at just under 0.6:


Figure 11


The causal relationship between the acceleration of debt and change in stock prices is more obvious when the 10 month lag is taken into account:


Figure 12


These correlations, which confirm the causal argument made between the acceleration of debt and the change in asset prices, expose the dangerous positive feedback loop in which the economy has been trapped. This is similar to what George Soros calls a reflexive process: we borrow money to gamble on rising asset prices, and the acceleration of debt causes asset prices to rise.


This is the basis of a Ponzi Scheme, and it is also why the Scheme must eventually fail. Because it relies not merely on growing debt, but accelerating debt, ultimately that acceleration must end—because otherwise debt would become infinite. When the acceleration of debt ceases, asset prices collapse.


The annual Credit Accelerator is still very strong right now—so why is unemployment rising and both housing and stocks falling? Here we have to look at the more recent quarterly changes in the Credit Accelerator—even though there is too much noise in the data to use it as a decent indicator (the quarterly levels show in Figure 13 are from month to month—so that the bar for March 2011 indicates the acceleration of debt between January and March 2011). It’s apparent that the strong acceleration of debt in mid to late 2010 is petering out. Another quarter of that low a rate of acceleration in debt—or a return to more deceleration—will drive the annual Credit Accelerator down or even negative again. The lead between the annual Credit Accelerator and the annualized rates of change of unemployment and asset prices means that this diminished stimulus from accelerating debt is turning up in the data now.


Figure 13


This tendency for the Credit Accelerator to turn negative after a brief bout of being positive is likely to be with us for some time. In a well-functioning economy, the Credit Accelerator would fluctuate around slightly above zero. It would be above zero when a Schumpeterian boom was in progress, below during a slump, and tend to exceed zero slightly over time because positive credit growth is needed to sustain economic growth. This would result in a private debt to GDP level that fluctuated around a positive level, as output grew cyclically in proportion to the rising debt.


Instead, it has been kept positive over an unprecedented period by a Ponzi-oriented financial sector, which was allowed to get away with it by naïve neoclassical economists in positions of authority. The consequence was a secular tendency for the debt to GDP ratio to rise. This was the danger Minsky tried to raise awareness of in his Financial Instability Hypothesis (Hyman P. Minsky, 1972)—which neoclassical economists like Bernanke ignored.


The false prosperity this accelerating debt caused led to the fantasy of “The Great Moderation” taking hold amongst neoclassical economists. Ultimately, in 2008, this fantasy came crashing down when the impossibility of maintaining a positive acceleration in debt forever hit—and the Great Recession began.


Figure 14


From now on, unless we do the sensible thing of abolishing debt that should never have been created in the first place, we are likely to be subject to wild gyrations in the Credit Accelerator, and a general tendency for it to be negative rather than positive. With debt still at levels that dwarf previous speculative peaks, the positive feedback between accelerating debt and rising asset prices can only last for a short time, since it if were to persist, debt levels would ultimately have to rise once more. Instead, what is likely to happen is a a period of strong acceleration in debt (caused by a slowdown in the rate of decline of debt) and rising asset prices—followed by a decline in the acceleration as the velocity of debt approaches zero.


Figure 15


Here Soros’s reflexivity starts to work in reverse. With the Credit Accelerator going into reverse, asset prices plunge—which further reduces the public’s willingness to take on debt, which causes asset prices to fall even further.


The process eventually exhausts itself as the debt to GDP ratio falls. But given that the current private debt level is perhaps 170% of GDP above where it should be (the level that finances entrepreneurial investment rather than Ponzi Schemes), the end game here will be many years in the future. The only sure road to recovery is debt abolition—but that will require defeating the political power of the finance sector, and ending the influence of neoclassical economists on economic policy. That day is still a long way off.


Figure 16


Bernanke, Ben S. 2000. Essays on the Great Depression. Princeton: Princeton University Press.


____. 2004. “The Great Moderation: Remarks by Governor Ben S. Bernanke at the Meetings of the Eastern Economic Association, Washington, Dc February 20, 2004,” Eastern Economic Association. Washington, DC: Federal Reserve Board,


Biggs, Michael; Thomas Mayer and Andreas Pick. 2010. “Credit and Economic Recovery: Demystifying Phoenix Miracles.” SSRN eLibrary.


Fisher, Irving. 1933. “The Debt-Deflation Theory of Great Depressions.” Econometrica, 1(4), 337-57.


Holmes, Alan R. 1969. “Operational Constraints on the Stabilization of Money Supply Growth,” F. E. Morris, Controlling Monetary Aggregates. Nantucket Island: The Federal Reserve Bank of Boston, 65-77.


Kornai, Janos. 1980. “‘Hard’ and ‘Soft’ Budget Constraint.” Acta Oeconomica, 25(3-4), 231-45.


Krugman, Paul and Gauti B. Eggertsson. 2010. “Debt, Deleveraging, and the Liquidity Trap: A Fisher-Minsky-Koo Approach [2nd Draft 2/14/2011],” New York: Federal Reserve Bank of New York & Princeton University,


Minsky, Hyman P. 1972. “Financial Instability Revisited: The Economics of Disaster,” Board of Governors of the Federal Reserve System, Reappraisal of the Federal Reserve Discount Mechanism. Washington, D.C.: Board of Governors of the Federal Reserve System,


Schumpeter, Joseph Alois. 1934. The Theory of Economic Development : An Inquiry into Profits, Capital, Credit, Interest and the Business Cycle. Cambridge, Massachusetts: Harvard University Press.


flattr this!

"

THE ECONOMIC ICE AGE

THE ECONOMIC ICE AGE: "

Some pretty interesting thoughts here from Societe Generale on the economic “ice age”. This is what their analysts refer to as the period after a bubble bursting has occurred. They’ve used the same Japan analogy that I am fond of. Pretty pessimistic thoughts (more so than mine), but I think they’ve got the macro situation understood better than most:


“In the aftermath of last week’s stunningly weak economic data the market is now beginning to acknowledge that, without a further round of QE a relapse back into economic stagnation or recession surely beckons.


In the post-bubble world, economic downturns = the most dangerous phase in the cycle. Both equity PE’s and government bond yields will make surprising new lows for a consensus totally convinced of extreme cheapness of equities and expensiveness of government bonds.


So, this week we revisit some of our old favourite “Ice Age charts” to see how far advanced we are in out post-bubble long march. The one below shows the US de-rating in exactly the same way Japan did a decade earlier.


The ice age theme = in a world of very low inflation, equities de-rate both absolutely and relative to government bonds. After equity valuations extremes seen during the 2000 bubble, we have entered a long valuation bear market which should end in extreme levels of cheapness consistent with an S&P around 400 and the unavoidable deep recession will drag an already “expensive” bond market to even higher levels.”


Sorry to ruin your pre-weekend with that delightfully bearish note. If it makes you feel any better, I think S&P 400 is extreme to say the least, but then again, I foresaw the housing crash and didn’t think equities would decline to 666 so I’ve been wrong before….


Source: Societe Generale

"

Thursday, June 09, 2011

Freakonomics � We’re Halfway to a Lost Decade

Freakonomics � We’re Halfway to a Lost Decade

Our Economic Future: From Best to Worst Case

Our Economic Future: From Best to Worst Case: "

There is a great deal of uncertainty among investors about what the future of the US economy may look like – so I decided to take a stab at what’s likely to happen over the next 20 years. That’s enough time for a child to grow up and mature, and it’s long enough for major trends to develop and make themselves felt.


I’ll confine myself to areas that are, as the benighted Rumsfeld might have observed, “known unknowns.” I don’t want to deal with possibilities of the deus ex machina sort. So we’ll rule out natural events like a super-volcano eruption, an asteroid strike, a new ice age, global warming, and the like. Although all these things absolutely will occur sometime in the future, the timing is very uncertain – at least from the perspective of one human lifespan. It’s pointless dealing with geological time and astronomical probability here. And, more important, there’s absolutely nothing we can do about such things.


So let’s limit ourselves to the possibilities presented by human action. They’re plenty weird and scary, and unpredictable enough.


THE MARKET FOR PROGNOSTICATION


People are all ears for predictions, whether from psychics or from “experts,” despite the repeated experience that they’re almost always worthless, often misleading and more than rarely the exact opposite of what happens.


Most often, the predictors go afoul by underrating human ingenuity or extrapolating current trends too far. Let me give you a rundown of the state of things during the last century, at 20-year intervals. If you didn’t know it’s what actually happened, you’d find it hard to believe.


1911 – The entire world is at peace. Stability, freedom and prosperity prevail almost everywhere. Almost every country in Europe is ruled by a king or queen. Western civilization has spread to nearly every corner of the world and is received with appreciation. Stunning breakthroughs are being made in science and technology. There’s no sign of a gigantic world war about to come out of nowhere to rip apart the political and cultural map of Europe and bankrupt everybody. Who imagined that a dictatorial communist regime would arise in Russia?


1931 – It’s early in a disastrous worldwide depression. Attention is on economic troubles, not on the virtually unthought-of possibility that in less than 10 years a new world war would be under way against Nazism and a resurgent Germany.


1951 – Except for Vietnam, all that remains of the colonies the West had established in the 19th century are quiescent. Nobody guessed almost all would either be independent, or on their way, in 10 years. China has joined Russia – and many other countries – as totally collectivist. Who imagined that Germany and Japan, although literally leveled, would be perhaps the best investments of the century? Who guessed that the US was already at its peak relative to the rest of the world?


1971 – Communist and overtly socialist countries all over the world seem to be in ascendance, soon to be buoyed further by a decade of rising commodity prices. The US and the West are entering a deep malaise. Little significance is attached to rumblings from the Islamic world.


1991 – Communism has collapsed as an ideology, the USSR has disappeared, and China has radically reformed. Islam is increasingly in the news.


2011 – The world financial/economic crisis is four years old, but things are still holding together. Islamic terrorism and collapse of old regimes in the Arab world dominate the news. China is viewed as the world’s new powerhouse.


BAD AND WORSE


Regrettably, I’m not much of a linguist. But I do pick up interesting semantic trivia. In Spanish they don’t say “in the future,” as we do in English, which implies a definite outcome. Instead they say “en un futuro” – in a future – which implies many possible outcomes. It’s a better way of assessing reality, I think.


Here are three 20-year futures to consider. There are, obviously, many, many more – but I think these encompass the three most realistic broad possibilities.


BEST CASE – FACTS GET FACED


Realizing what a disaster the complete destruction of their currencies would be, most governments decide to endure the pain of allowing interest rates to rise and limiting increases in the money supply. Poorly run corporations and banks are left to fail. Talk of abolishing the Federal Reserve, and using a commodity for money, becomes serious and widespread.


Shaken, the US ends its profligate ways, in part because it lacks the means to continue, and in part because everyone but collectivist ideologues has actually learned something from the brutal ’10s and ’20s.


Amidst massive protests, the government closes much of its counterproductive apparatus, eliminates many taxes, and lets 30% of its employees go. It also, albeit reluctantly, liberalizes its regulation of the economy because it has become impossible to deny that the US has been falling behind in all areas.


Although there is a resurgence of libertarian thought – reminiscent of the Reagan-Thatcher era – simple practicality is mainly responsible for forcing the government’s hand. For one thing, it can’t afford the bureaucracy needed to enforce detailed interference. For another, entrepreneurs are increasingly just doing what they please, partly from necessity and partly from a growing sense of righteousness. Interest rates go to 25%, to compensate for high levels of inflation. That’s high enough to make it worthwhile for people to save, and the capital base starts growing. The stock market has collapsed to its lowest level in living experience (in real terms), but the values available encourage people to become investors. Business is restructured on a sound, debt-free basis, with little speculation.


The US radically cuts its military spending and pulls almost all troops out of their foreign bases and wars. The War on Drugs comes to an end, and the crime rate in both the US and Mexico plummets.


The government solves most of its overhanging financial problems with a seriously devalued – but not hyperinflated – dollar. The Social Security deficit is eliminated by abstaining from benefit increases and by inflating away much of what had been promised before. Most Americans suffer a severe drop in their standard of living, as they’re forced into new patterns of production and consumption. A generation of college students find that their degrees in sociology, political science, economics, English lit, Black studies, gender studies and underwater basket weaving are of no real value.


When it’s all over, the tough times that started in ’07 prove to have been no more than a cyclical bump in the road, like all the other recessions since WW2, just much bigger.


A rough and memorable ride, but it ends with a return to prosperity.


MIDDLE CASE – FACTS ARE IGNORED


The world’s governments continue under the delusion that printing massive quantities of paper money will solve problems when, in fact, printing lies at the base of the problems. Most currencies lose most of their value. Some lose it all. This destroys the most productive people in society, the middle class, who produce more than they consume and save the difference… in currency.


And it injures successful corporations that have billions, or even tens of billions, in cash. Few of their managers know what to do with such sums other than to hold currency; at best they’ll buy their own and other companies’ stock. The result is a stock market boom in the midst of a grim depression. But only one person in a hundred will be in a position to benefit from it, because most will be living too close to the edge, and the stock market will be the last thing on their minds. The destruction of capital sets technology back quite a bit in the US, Japan and Europe. Chindia increases its relative strength.


The US government, believing it has both the obligation and the ability to “do something,” redoubles its control of the economy. Price controls and capital controls are the order of the day. Petroleum products are rationed. Enforcement of new regulations is assigned to a new agency, the “Economic Recovery Administration,” which resembles the TSA in most regards – except it has many plain-clothes employees, to better ferret out violators.


People think increasingly of politics as the way to get what they want. More and more Americans move abroad – although things are deteriorating in most places in the world. Poor, backwater countries offer the best opportunities because their governments are either weak, or corrupt, enough to allow new economic activity.


To be continued…


Regards,


Doug Casey

for The Daily Reckoning


Our Economic Future: From Best to Worst Case originally appeared in the Daily Reckoning. The Daily Reckoning provides over half a million subscribers with literary economic perspective, global market analysis, and contrarian investment ideas.


"